
Two Means Statistically Significant - Excel T Test
/Two means, is the difference significant?
Statistics can be difficult to grasp - especially when you are trying to figure out if something is statistically significant. However comparing two means for significant differences is easy thanks to Excel.
For this example, you are growing two rows of ten grape vines.

Every week, you have measured the growth of the plants for both rows. One row has fertilizer, the other doesn’t. Has the fertilizer made a significant difference? Let’s find out!
Fire up Excel
We have 5 weeks with of data, we take the average growth of the ten plants to make up our weekly row average. This is what we will be comparing for significant difference.

There is a difference in the overall average, however you can see quite a bit of variability in the weeks. Was this just random chance, or the fertilizer having an effect?
Add Data Range
Start using the formula =T.TEST and select your first data range and your second.
Select your control first, then your test.
=T.TEST(C4:C13,D4:D13)
Add Tails
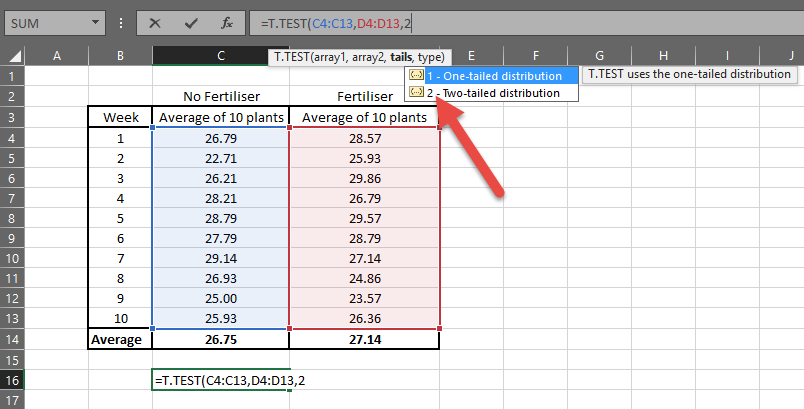
You now need to select the tails.
One Tailed = You know your test average will be HIGHER than your control. Or you know it will be LOWER. Not both. Or you only care about one direction, as the impact of the other direction is of little consequence. If you are even a tiny bit unsure, don’t use this option as you can get into misleading data and ethical problems quickly.
Say we are trying to create a new fertilizer - I have a great new product name and think I can create a lot of money with a new product. I don’t care if the new fertilizer is better than our current product, I only care that it is not worse. In this case, I would use One Tailed.
Two Tailed = Your test average could be HIGHER or LOWER - you are not exactly sure which one.
I don’t know if adding the fertilizer will give it a higher growth average or lower, so I will select Two Tailed.
If in doubt, select Two Tailed.
=T.TEST(C4:C13,D4:D13,2
Add Type
Finally you need to specify the type - this is what usually confuses people.
Paired = You are comparing the control and test from one plant.
For example If I recorded the growth without fertilizer for a few weeks, added fertilizer to that plant and recorded the growth, I would select Paired. My test plants are different from my control plants, so I will not select this option.
Two-sample equal variance = You have two samples, and the variance from sample to sample is similar for both control and test groups.
For example, I know the variation from plant 1 to plant 2 in my control group, will be similar to the variation in my test group.
Two-sample unequal variance = You have two samples, and the variance from sample to sample could be different for control and test groups.
You would almost always select this if people were making up your two groups. The variation from person to person would likely be different for your two groups.
If in doubt, always go with Two-sample unequal variance.
However I am confident the right type for my data is Two-sample equal variance, which is relatively uncommon in these scenarios. I will further validate my confidence by running a F.test, which tells you if the variance is significantly different.

Simply select your data range (your control always comes first), and see what comes out. =F.TEST(C4:C13,D4:D13)
I got 0.85. The Alpha for this test 0.05 - if your score was below that it tells you the variation IS significantly different. My score was not, so I can assume the variance is equal.
The F.TEST isn’t necessarily robust enough to give you the right answer for selecting the type, so if you are unsure select Two-sample unequal variance.
T.TEST Created - let’s analyse
=T.TEST(C4:C13,D4:D13,2,2)
You should have something similar to the below. Alpha is always 0.05 in this case. Manually write that in, as it is not a formula.
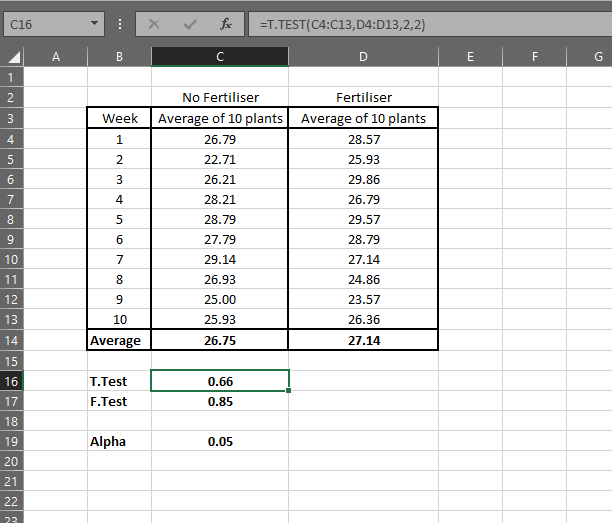
The result, 0.66, needs to fall below the Alpha of 0.05 to be statistically significant. So I can’t say the fertilizer had a significant impact - it is more likely to be random chance.
However if the small difference does have a positive impact on grape production, I would recommend we expand the sample size and duration to further test.
It’s as simple as that. For most cases, =T.TEST(Control,Test,2,2) will be the correct formula to use.
Now you have some data, why not use it to create forecasts? For example how much fertilizer do we need to add to get the highest growth? Follow my Linear Forecast in Excel Tutorial.
Or if you want to run the T.Test every week, why not use an Excel Macro Scheduling technique with an Automated Email Excel Macro?